How to Use the Report Toaster API
In this article, we take a look at how you can use the Reporting API in Report Toaster.
What is the Reporting API
The Reporting API is designed to give you programmatic access to your Report Toaster data. This is invaluable if you want to use this data in other apps and services.
All endpoints are GET requests that return JSON, and most operate on a {modelName} path segment to identify the model you want to query.
Endpoints are read-only. To run a query, point at one of the supported models and pass JSON-encoded query parameters.
You can find all the details for this in the Report Toaster app by going to the Settings menu in the lefthand navigation pane and scrolling down to the Reporting API section:

Let's take a look at how this works!

You can sign up anytime by following the directions here.
API Key
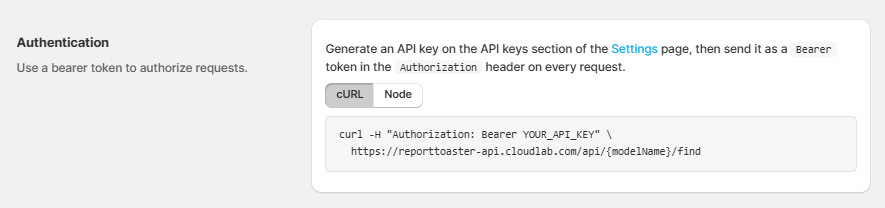
First, you need to create an API Key for authentication. This will be sent as a Bearer token in the Authorization header of every request.
cURL and Node Authentication options can both be used, depending on what you are looking to accomplish.
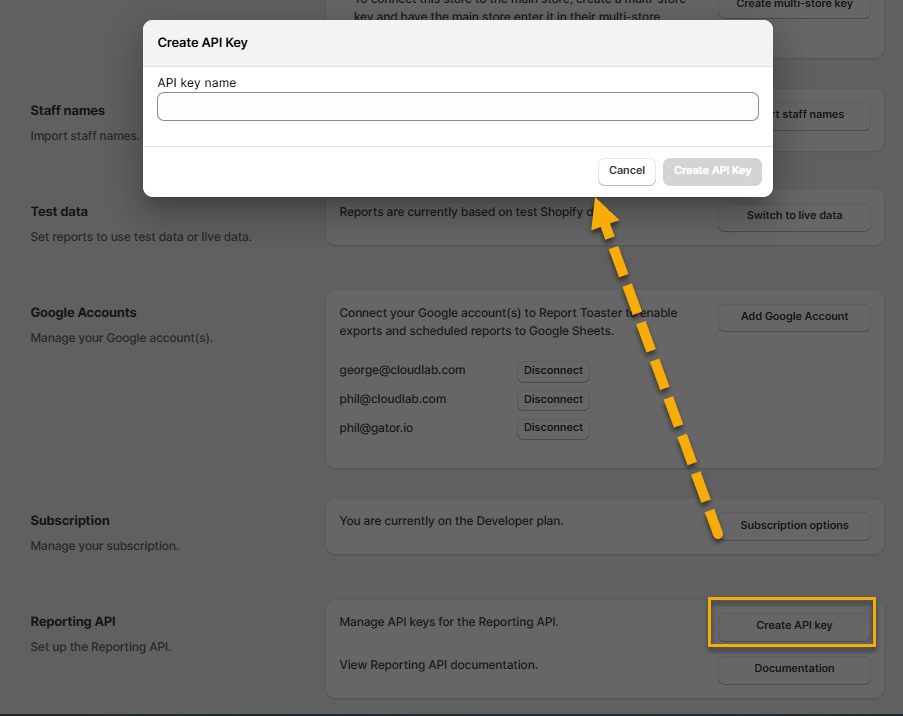
We can create the API Key from the Settings page, so navigate back to there, click Create API key, and enter a name for it accordingly.
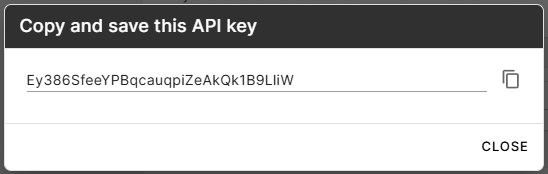
This will then generate an API Key for you. Copy it and store it somewhere safe for ease of future reference
Base URL
Next we'll create the base URL. This is fairly self-explanatory - we're just taking this URL - https://reporttoaster-api.cloudlab.com/api/{modelName} and replacing {modelName} with one of the applicable models from the list in the Documentation section.
 For example, https://reporttoaster-api.cloudlab.com/api/{VariantDetailView}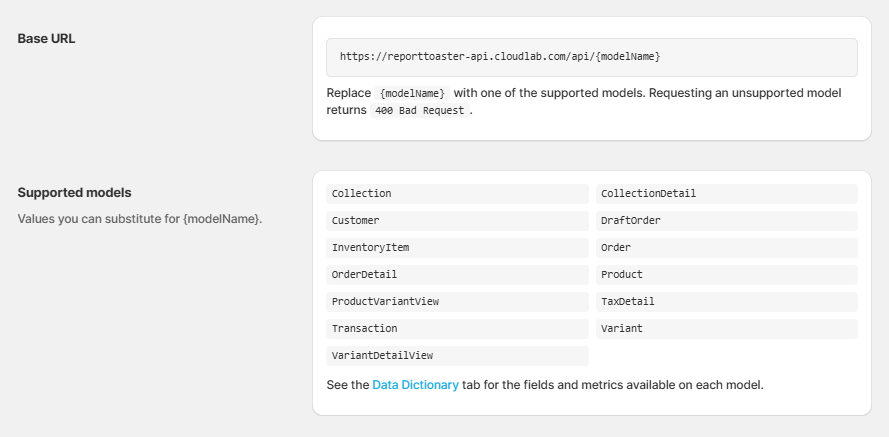
API Calls
These are detailed in the Documentation section under the API tab.
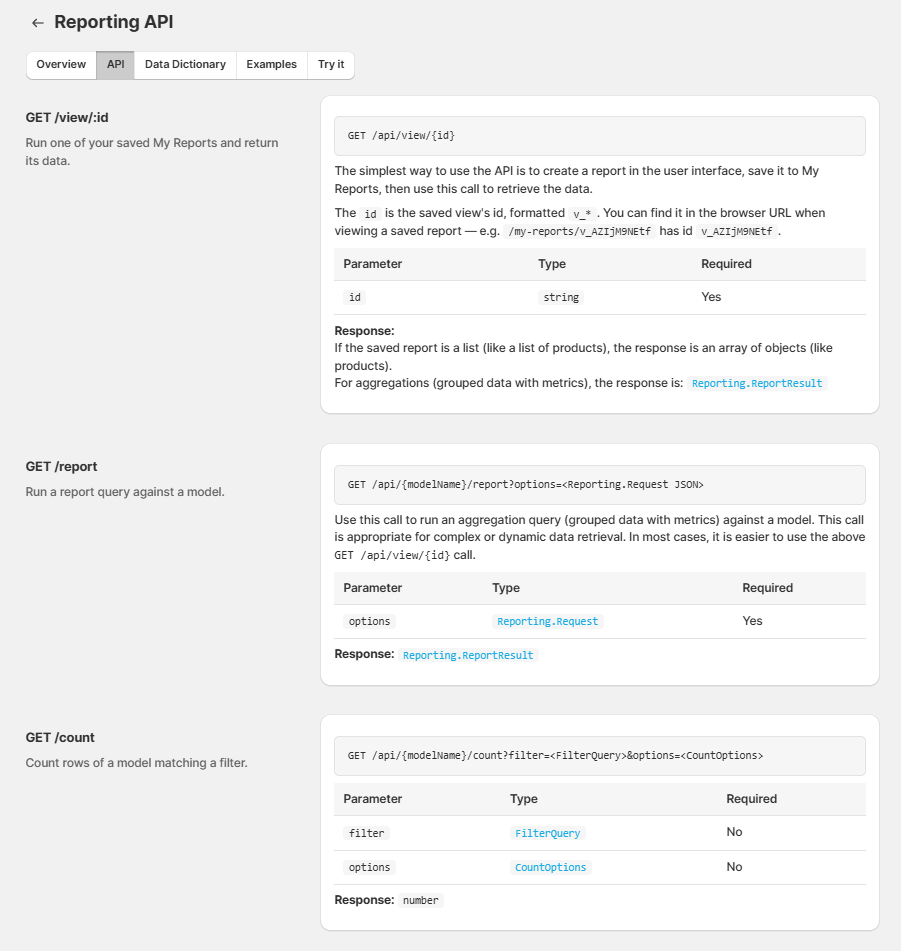
Here you have a variety of different options, which are all detailed in the applicable tab above. We'll provide a quick overview below.
GET /view/:id. Run one of your saved My Reports and return its data. If it's a list report, it returns an array of objects. If an aggregation report, the response is Reporting.ReportResult.
GET /report. Run a report query against a model (see the Supported Models under the Overview tab). This is best for more complex/dynamic data retrieval, but most of the time, the view ID call is more suitable. Returns Reporting.ReportResult.
GET /count. Count rows of a model matching a filter. Returns a number.
GET /findById. Fetch a single row of a model by id. In this case, the id the numeric Shopify id. This can be used on the following models: Collection, Customer, Draft Order, InventoryItem, Order, Product, Transaction, Variant. Returns the row (or 404 if not found).
GET /find. List rows of a model matching a filter. Returns all the matching rows as an array.
 You'll want to JSON-encode each value before passing it as a query string parameter.
FilterQuery Operators
For FilterQuery (i.e. a MongoDB-style filter object), the following operators are all supported:
$eq (match an exact value)
$ne (match any value except the one listed)
$gt (greater than)
$gte (greater than or equal to).
$lt (less than).
$lte (less than or equal to).
$in (match any value from a list).
$nin (match anything not in a list).
$and (all sub-conditions must match).
$or (any sub-condition must match).
$regex (match a regular expression against a string field).
Options
For /find:
limit (number) - The maximum number of rows to return per page (default = 10)
page (number) - 0-indexed page number. Used with limit to page through the results
sort (object) - Format { field: direction } where 1 is ascending and -1 is descending.
projection (object) - If set, the call returns only the fields you list (each field set to 1). If not set, all fields are returned.
{ "limit": 50, "page": 0, "sort": { "created_at": -1 }, "projection": { "name": 1, "email": 1, "total_spent": 1 } }
For /findbyID:
projection (object) - If set, the call returns only the fields you list (each field set to 1). If not set, all fields are returned.
For /count:
limit (number) - Cap the count at this number.
skip (number) - Skip this many rows before counting.
Reporting.Request
Here we can look at all the parts of the definition of a report query.
columns (string) - Required, basically which fields and metrics you want to include in the report. Each entry in the columns is either a field (from the model) or a metric (from the model's metrics).**
filter (FilterQuery) - Filter applied to the results before grouping.
ranges (DateRange) - The date range with any optional intervals.
sort (object) - Format { field: direction} where 1 is ascending and -1 is descending.
limit (number) - Maximum number of rows to return.
timeZone (string) - IANA timezone, e.g. America/New_York. Defaults to shop's timezone if not set.
**All field columns are used to group the report (1 row is returned per unique combination of field values, and metrics are aggregated within each group)
For example:- "created_at" = a field on the model
- "default_address.city" = an embedded field (use dot notation to drill into a subobject)
- "total#sum" = a metric. See the metrics section in the data dictionary tab.
{
"columns": ["country", "default_address.city", "orders_count#sum"]
}
DateRange
For Reporting.Request ranges, use the following:
on (string) - The name of the field being used for the date range (e.g. order_date, product_published_at, etc)
dates { start, end?}[] - One or more inclusive ranges. You can use either standard or relative date strings here (see below). If end is left out, the range is just the full unit of start.
interval (string) - Used if you want to group the results by a certain interval (e.g. yearMonth if you want the results returned in a monthly grouping). If this is not sent, the results will be a single summary row for the whole period.
For example:
{
"on": "created_at",
"interval": "date",
"dates": [{ "start": "2026-04-01", "end": "2026-04-30" }]
}
For Standard Dates, use ISO-style formats. E.g. YYYY-MM-DD for just a calendar date (e.g. 2024-01-15) or YYYY-MM-DD HH:MM for a date with a time (e.g. 2024-01-15 13:30)
For Relative dates, these are evaluated server side using the report's timezone. E.g. "today" would be the current calendar day. 3 days from now would be 3 days ahead from today.
For example:"on": "created_at",
Finally, note you can mix Standard and Relative dates, just keep in mind that this will likely produce variable results.
Reporting.ReportResult
These will be the responses from /report
rows (object []) - Result rows. Each row keys columns by name
columns (object []) - Column metadata for each entry in rows.
page (number) - Current page number, when pagination is used.
{ "columns": [ { "name": "created_at", "title": "Created at" }, { "name": "total", "title": "Total" } ], "rows": [ { "created_at": "2024-01-01", "total": 1234.50 }, { "created_at": "2024-01-02", "total": 980.00 } ] }
Errors
If you see an error, this will be the result of one of the following:
400 (unsupported model name or malformed query parameters).
401 (missing or invalid API key).
403 (the view belongs to a different account).
404 (row or view with the given id was not found).
Data Dictionary
Here is every field and metric reference for each supported model.
Choose the applicable model you are working with from the dropdown. You can select either Fields and Metrics (depending on whether you are looking for standard or aggregated values)
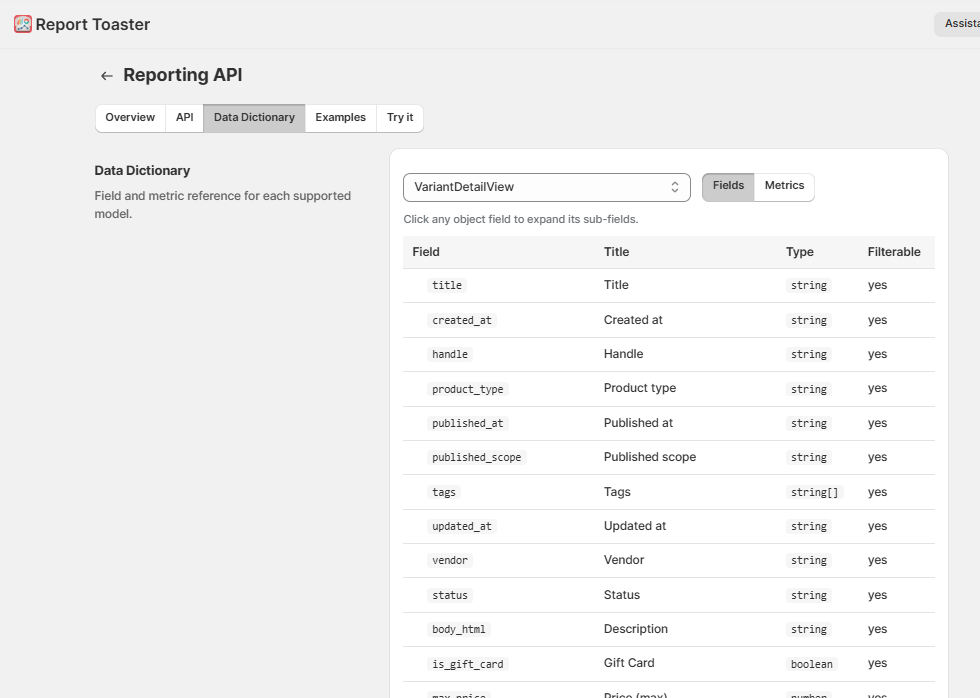
Examples and Testing
Under the Examples section, you can find some sample API calls so you can see how the whole thing comes together (again, you can choose between cURL and Node).
You can see here we have the base URL, the placeholder API key, the API call, and any applicable options.
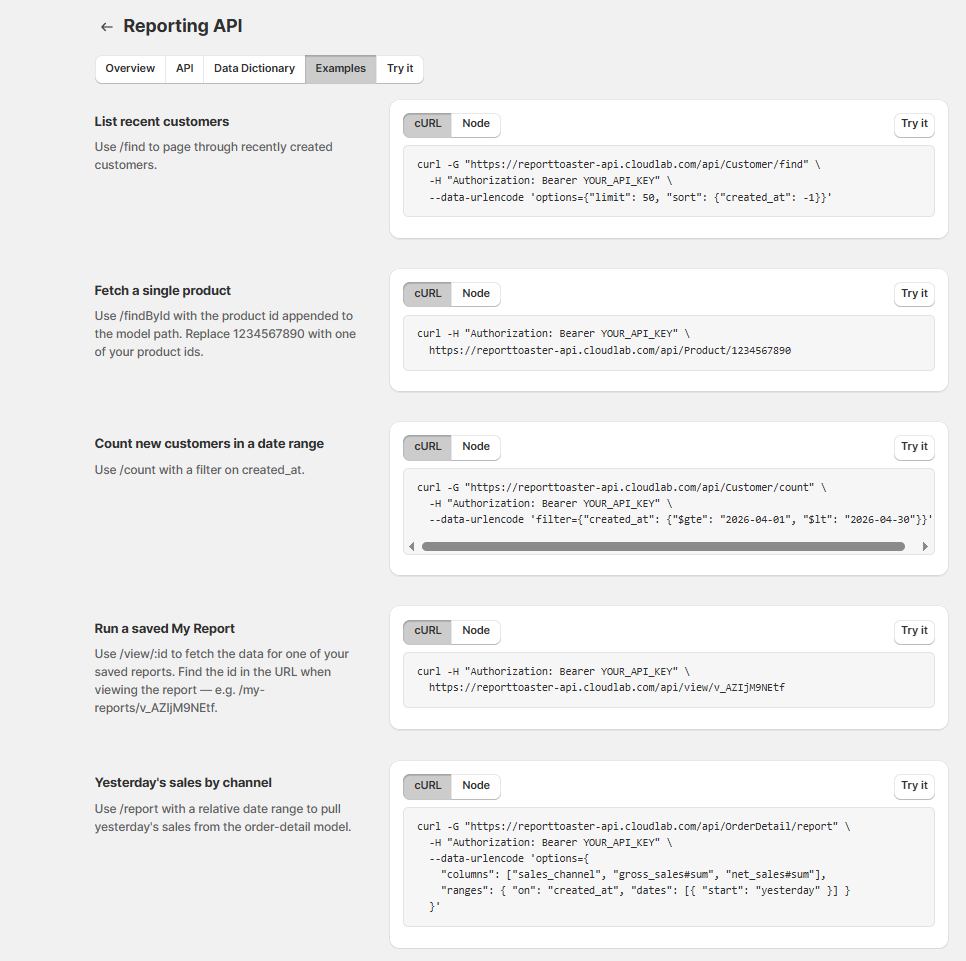
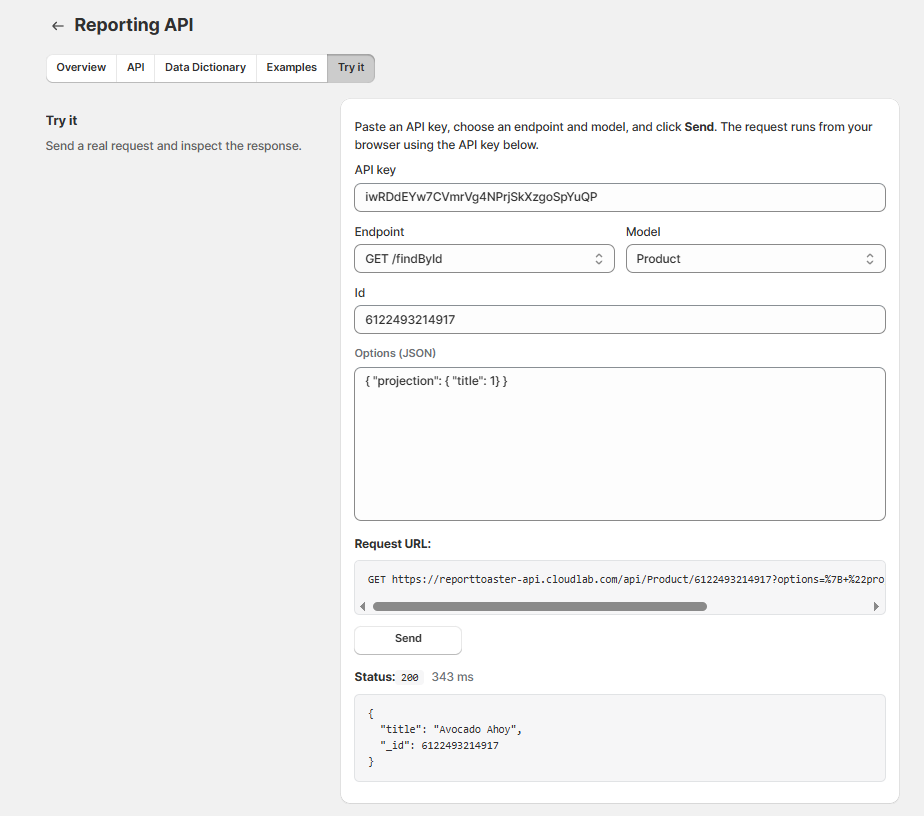
Finally, in the Try It tab, you can actually see how it works before setting up the real thing.
Enter your API key from the Settings page
Choose an applicable Endpoint from the dropdown
Choose an applicable Model from the dropdown (if applicable).
Enter your chosen Options (if applicable).
Enter your chosen Filter (if applicable).
Here's one we did ourselves so you can see how this might look (but again, the Examples page has plenty of others you can test). This is just a simple product ID lookup, returning only the title:
And then that's basically it!
If you need help with the Report Toaster API then please contact us at support@cloudlab.com and we'll be happy to help you out.