
How Do I Use a Metrics Filter
Another entry in our 'Basics' series, this article will cover how to use a Metrics Filter in Report Toaster.
Note - While included in our 'Basics' series, Metrics Filters are typically intended for more sophisticated users of Report Toaster. Feel free to ask us for help!
What Is a Metrics Filter?
A normal filter is used to filter on a specific attribute.
For example, if I filtered a Sales by Product report to show me only products where the Product Type is equal to Animal:
(click image to enlarge)
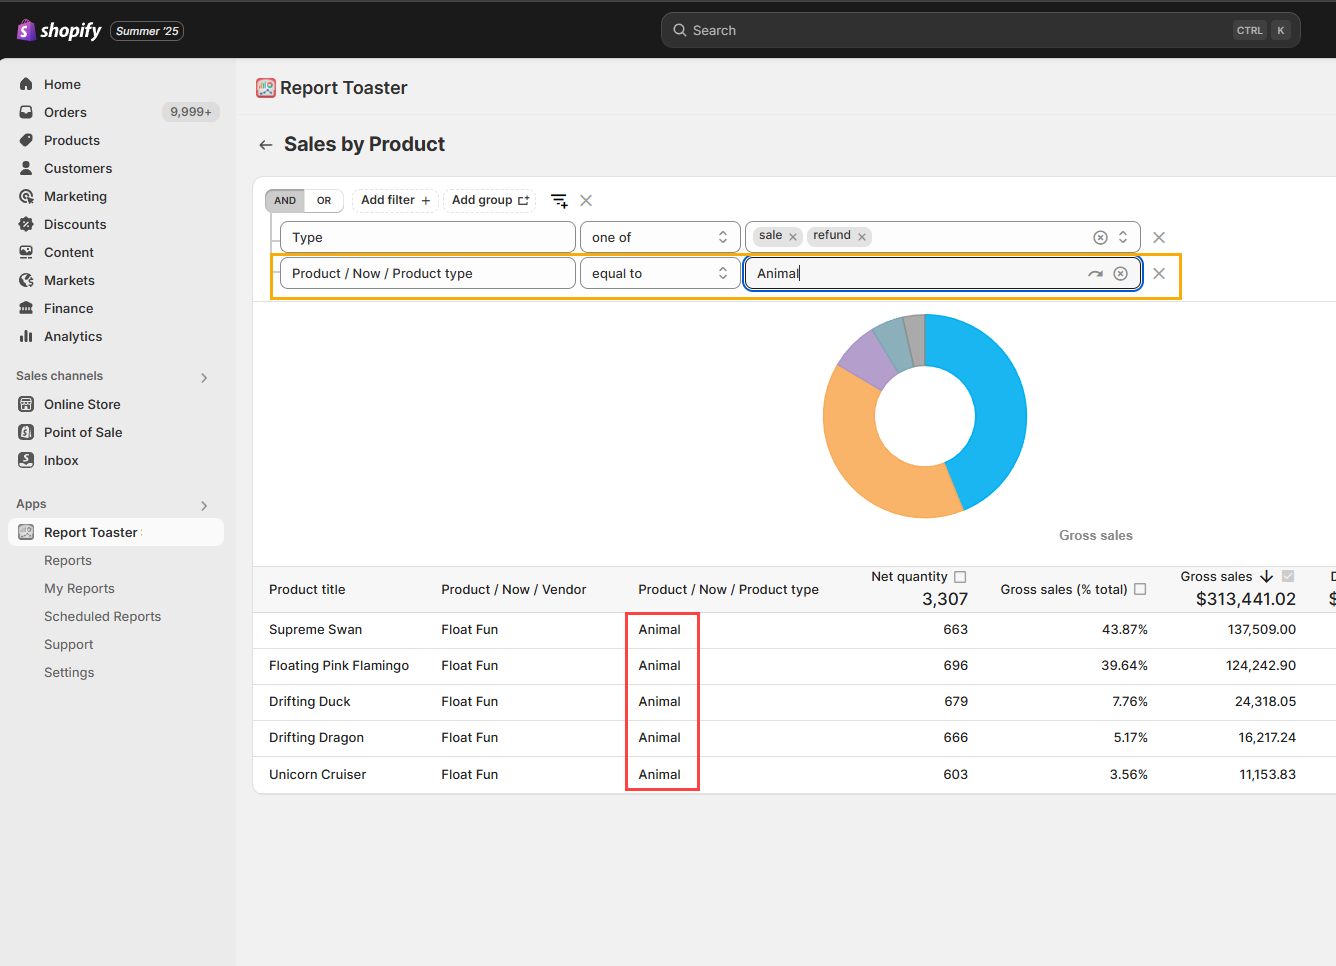
In contrast, Metrics filters are used when you want to filter based on a metric (e.g., Net Quantity) for an individual row.
This is easiest to illustrate with an example.
How Does It Work?
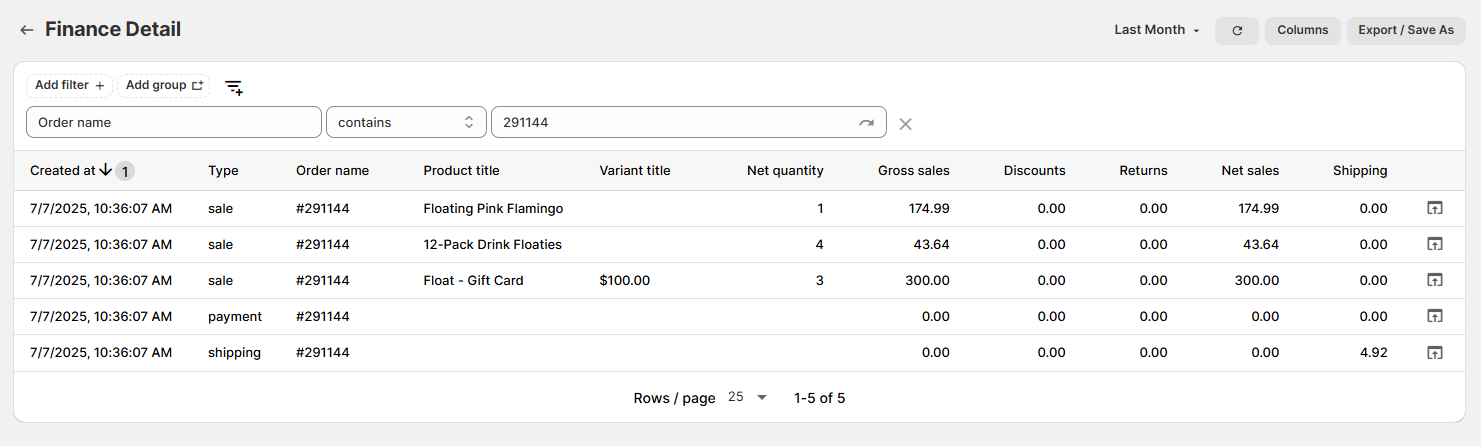
Suppose we were looking at an order that has a mixture of items ordered on it:
(click image to enlarge)
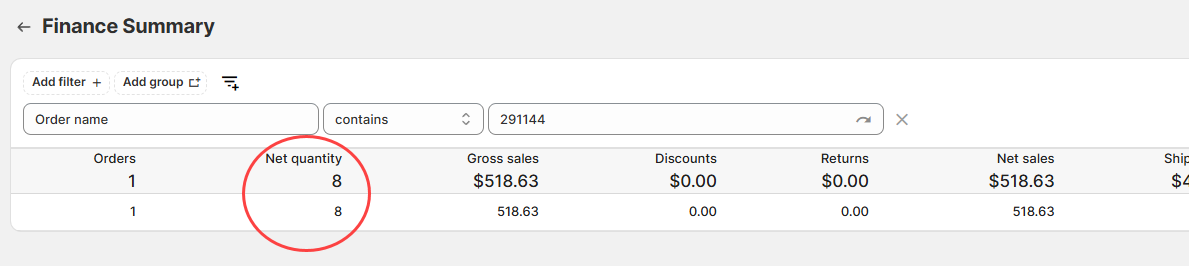
Now let's look at a Summary Report (i.e., anything with totals in the header - like Finance Summary).
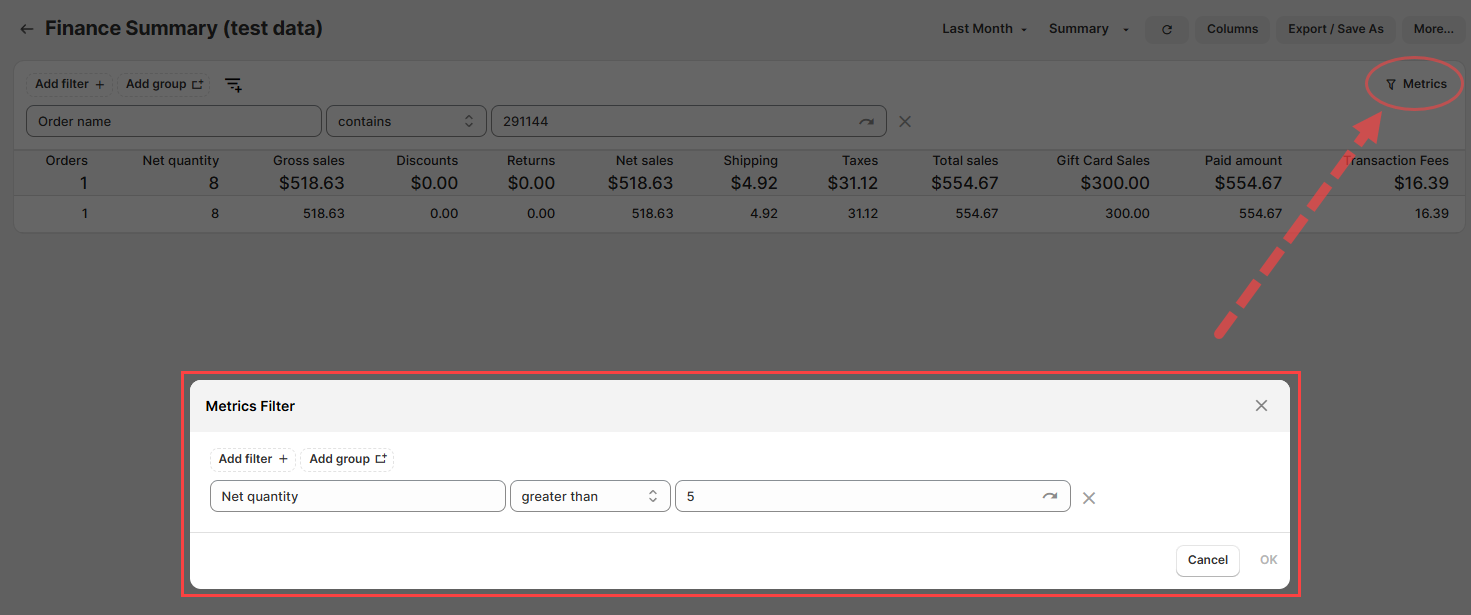
Here we can see that if we again used the regular filter to limit the results to just that order, we would see that the person ordered a total Net Quantity of 8 items:
(click image to enlarge)
So, what would happen if we added a filter for "Net Quantity greater than 5"?
(click image to enlarge)
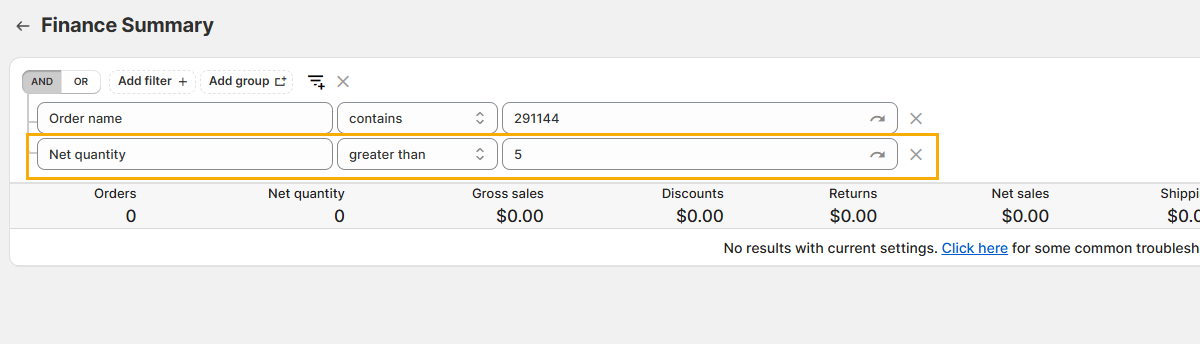
We would get no results! Why?
A normal filter will look at all the individual sale lines on the order (see our first screenshot in this example).
None of our items (individually) have a Net Quantity greater than 5 -> they are all 3, 4, and 1 respectively. So nothing meets our filter criteria!
A metric filter will instead look at the total quantity in aggregate for that row.
As long as we are grouping our results by individual order (see below), a metric filter for "Net Quantity greater than 5" would display our order:
(click image to enlarge)
So, how might this work in a real use case?
Putting It Into Practice - Tips and Tricks
Well, suppose I want to find all orders with more than 5 items on them?
For this to work, we need to make sure Order Name is on there as a column. This is because we want our results grouped by each individual order:
(click image to enlarge)
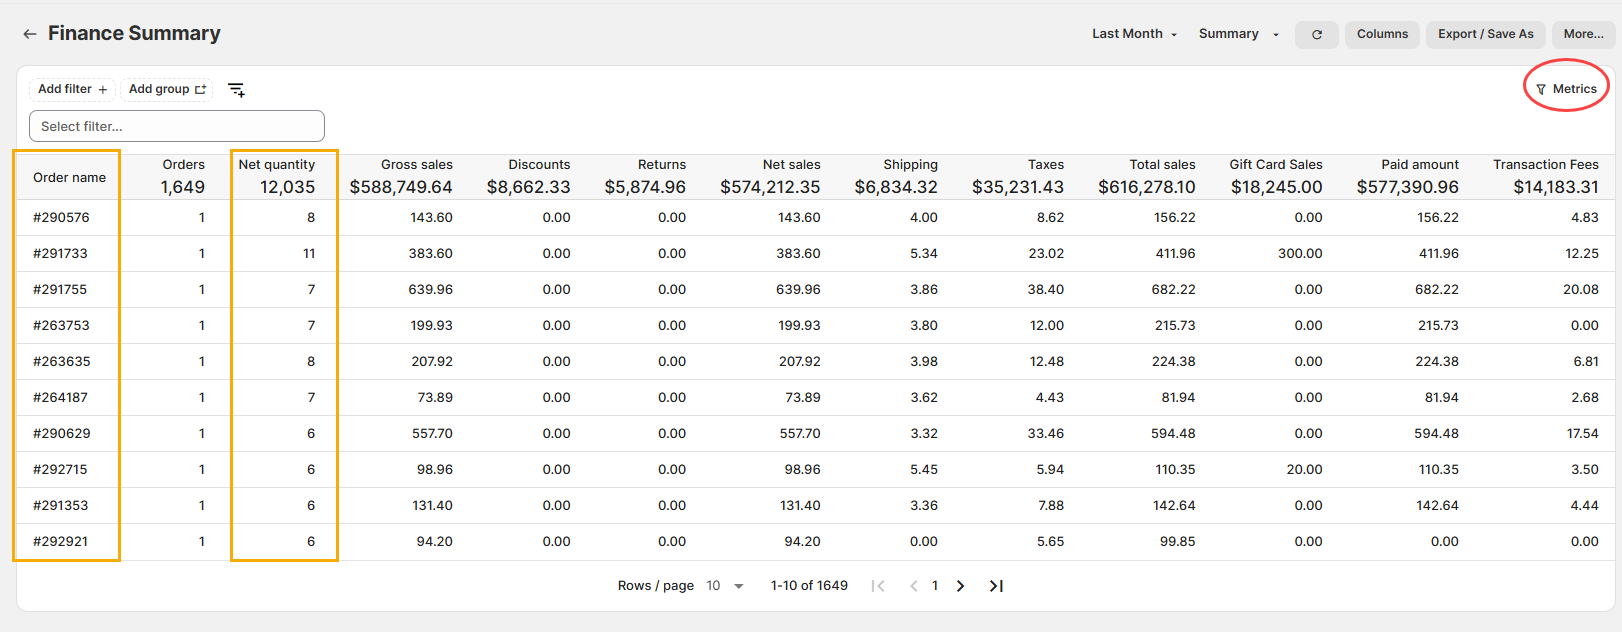
Now we can see all orders with 5+ items on them.
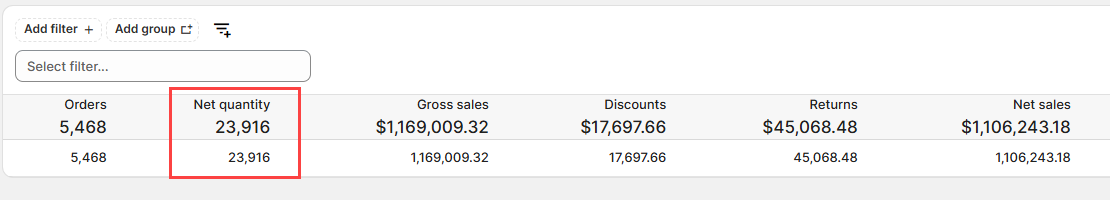
Note that if we removed Order name, we'd get a single summary row for everything, just like the default Finance Summary.
This row would of course have Net Quantity greater than 5 (23,916)... so every single order would qualify, which is NOT what we want!
(click image to enlarge)
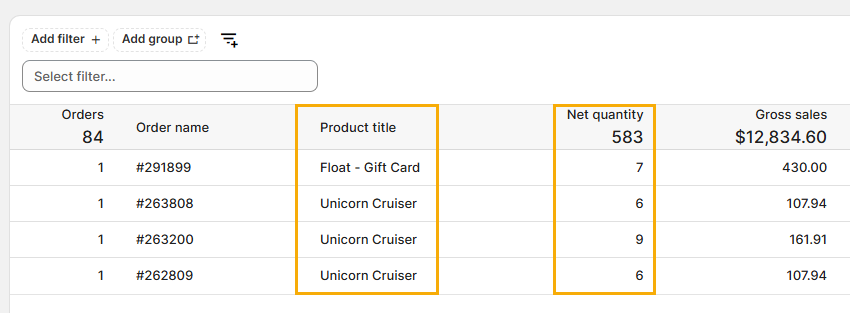
Likewise, if we added Product Title on there as a column, the report would be broken down into one row for each individual product on an order.
So, with that same metric filter, this report would now be showing who ordered 5+ of any one individual product, not 5+ items on a single order.
(click image to enlarge)
The key thing to bear in mind then is how your report is broken down. Is it by order, by product, by customer (or is it just a single summary row of everything)?
Either way, the metric filter is filtering on a metric for an individual