
Premium Report - Sales by Compare at Price
Sales by Compare at Price
These reports is used for seeing which products are selling at Full Price vs Markdown.
This is determined by looking for any instances of where the product's actual sale Price differs from its Compare at Price - the Shopify equivalent of the Recommended Retail Price (RRP).
As a Premium Report, this is available on all Paid Plans of Report Toaster. If you aren't signed up, follow these steps to upgrade your account.
Using these reports, you can see which products sold at which price level, as well as which products are missing their Compare at Price.
These reports are essentially the same, it's just that one provides your totals for each pricing tier:
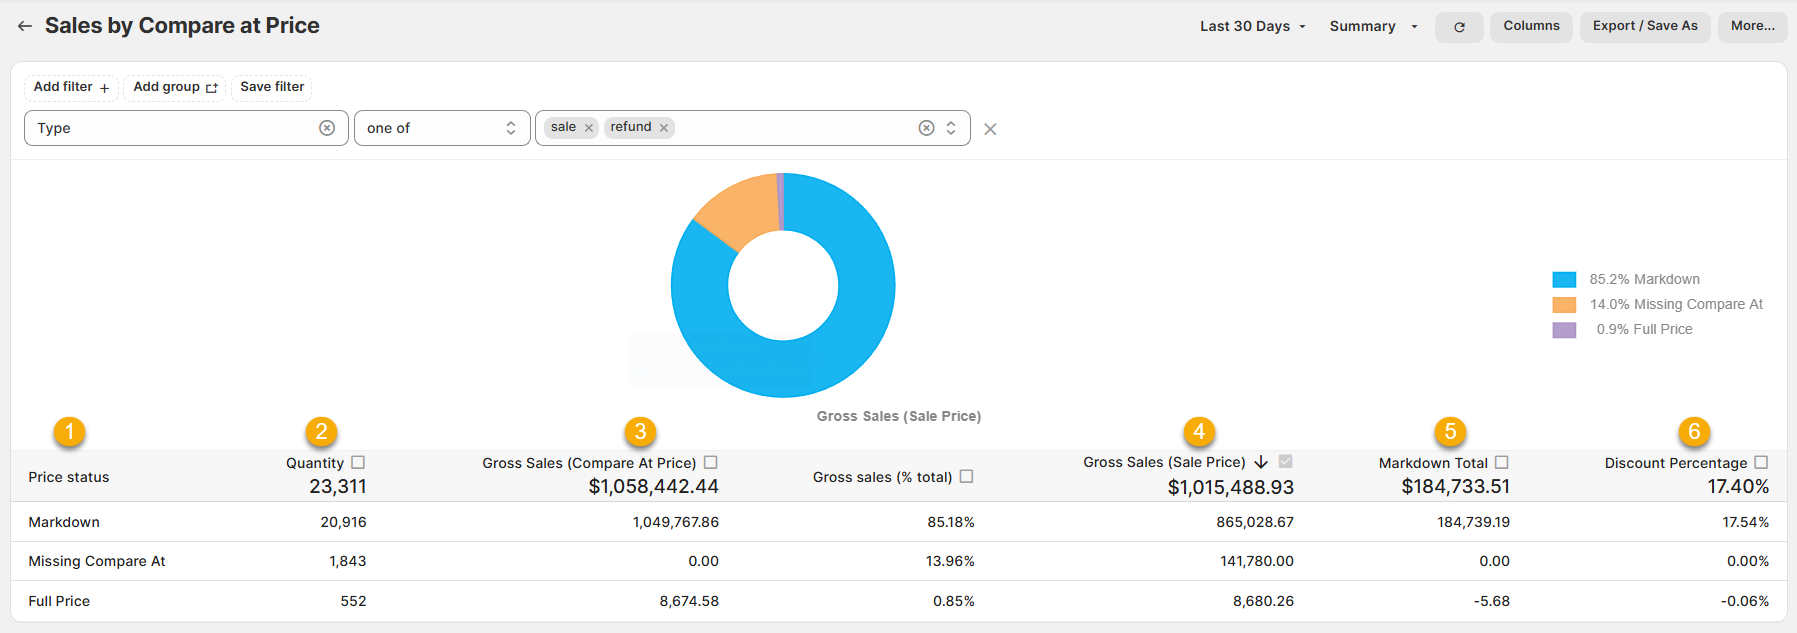
(click image to enlarge)
And the other provides a breakdown by individual product:
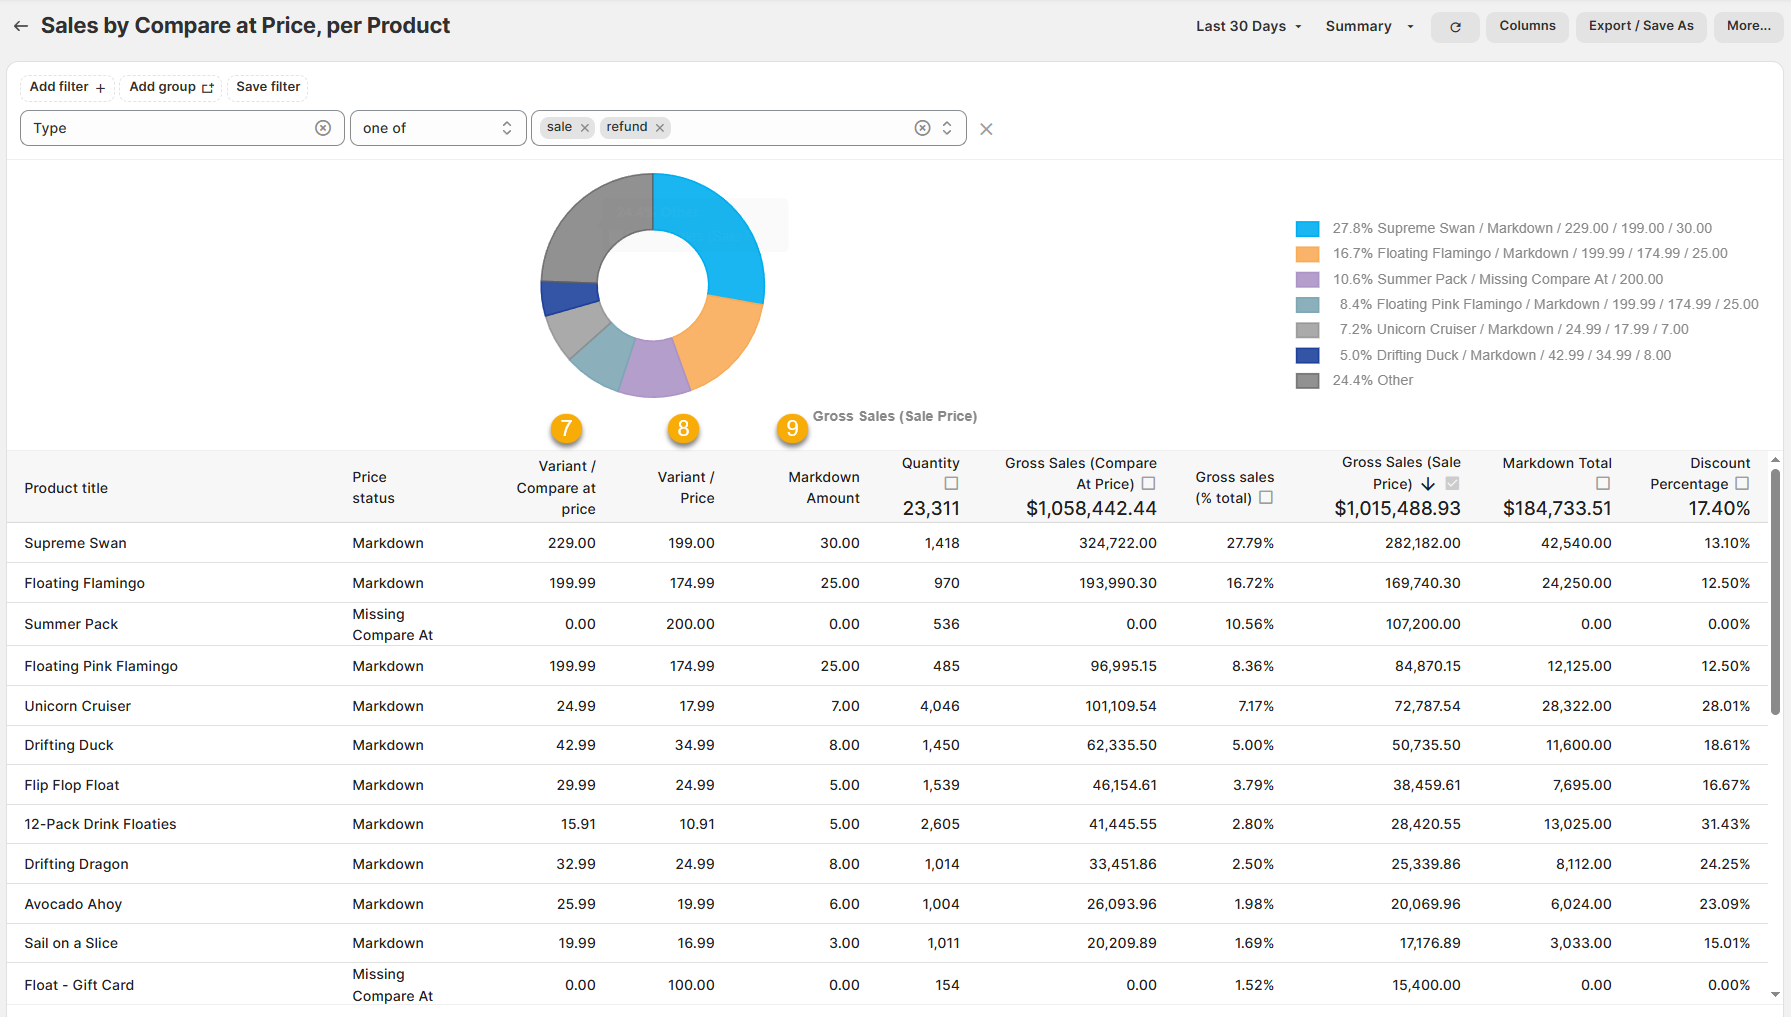
(click image to enlarge)
Here are a few terms to be familiar with in order to understand our Price Markdown reports, numbered in the screenshots above:
1.) Price Status:
The Price level for the specific product. This is broken down into
Markdown. Where the Price the product sold for is less than the Compare at Price.
Full Price. Where the Price the product sold for is equal to the Compare at Price.
Missing Compare At. Where no Compare at Price is set for the product in question
For example, if the Supreme Swan product had a Compare at price of $229.00 and sold for $199.00, it would be listed as Markdown.
2.) Quantity:
The quantity of that product sold at that particular price tier.
For example, if 1,418 of the Supreme Swan product sold at Markdown, then 1,418 would populate the field.
3.) Gross Sales (Compare at Price):
The Compare at Price x Quantity for that product at that particular price tier.
For Markdown products, this represents how much they 'would have sold for' had they actually been bought at the full price.
For Full Price Products, this is identical to Gross Sales (Sale Price), below.
For Missing Compare At, this is 0.00 - because there is no Compare At Price for those products.
For example, if 1,418 of the Supreme Swan product sold, and the Compare at Price is $229.00 each, then $324,722.00 would appear in the Gross Sales (Compare at Price) field.
4.) Gross Sales (Sale Price):
The Price x Quantity for that product at that particular price tier.
For example, if 1,418 of the Supreme Swan product sold for $199.00 each, then $282,182.00 would appear in the Gross Sales (Sale Price) field.
5.) Markdown Total:
Gross Sales (Compare at Price) minus the Gross Sales (Sale Price)
For example, if the Gross Sales (Compare at Price) for the Supreme Swan was $324,722.00 and the Gross Sales (Sale Price) was $282,182.00, then we know that the Markdown Total was $42,540.00.
6.) Discount Percentage:
The Markdown Amount divided by Variant / Compare at Price x100.
For example, if the Supreme Swan product variant has a Markdown Amount of $30 and a Compare at Price of $229.00, then 220.00/30 x 100 = 13.10%
7.) Variant / Compare at Price:
The Compare at Price for the individual product variant.
For example, the Supreme Swan product variant has a Compare at Price of $229.00
8.) Variant / Price:
The Price for the individual product variant.
For example, the Supreme Swan product variant has a Price of $199.00
9.) Markdown Amount:
The Compare at Price minus the Price for the individual product variant.
For example, if the Supreme Swan product variant has a Compare at Price of $229.00 and a Price of $199.00, then the Markdown Amount is $30.00.
Like all Report Toaster reports, these reports are fully customizable - so you can adjust the date range, add/remove columns, introduce a filter or change the sort to suit your individual needs. See our basic guides here for more info.
If you want to see our other premium reports, check out our main section here.