
Premium Reports - Inventory History
Inventory history reports are used for tracking changes to inventory at either a given point in time (e.g. Today) or over a select period (e.g. Last 30 Days). You can customize this time period via the date range (top right).
Inventory History needs to be enabled by our Report Toaster staff. Please contact us at [email protected] so we can set these reports up for your account.
As Premium Reports, these are available on all Paid Plans of Report Toaster. If you aren't signed up, follow these steps to upgrade your account.
All of these reports let you see the details for your historical inventory, including things like the Price, Cost, and Inventory States (see below).
These reports all follow a similar format, split up into:
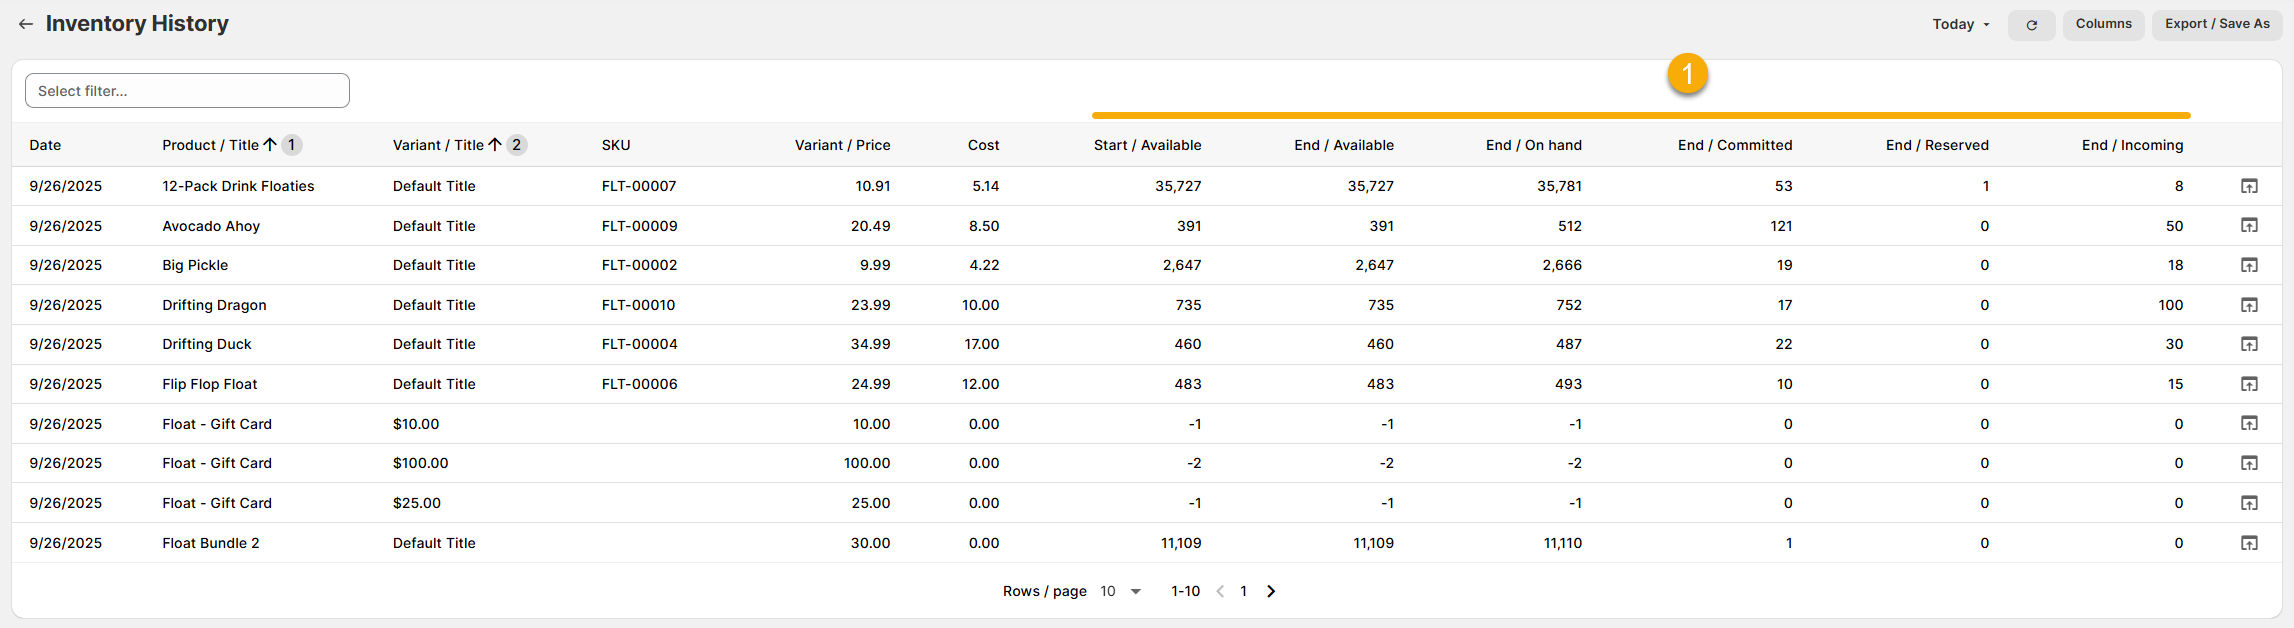
Inventory History
This report is ideal to look at the details for your historical inventory at a specified point in time/date range on a per variant basis.
(click image to enlarge)
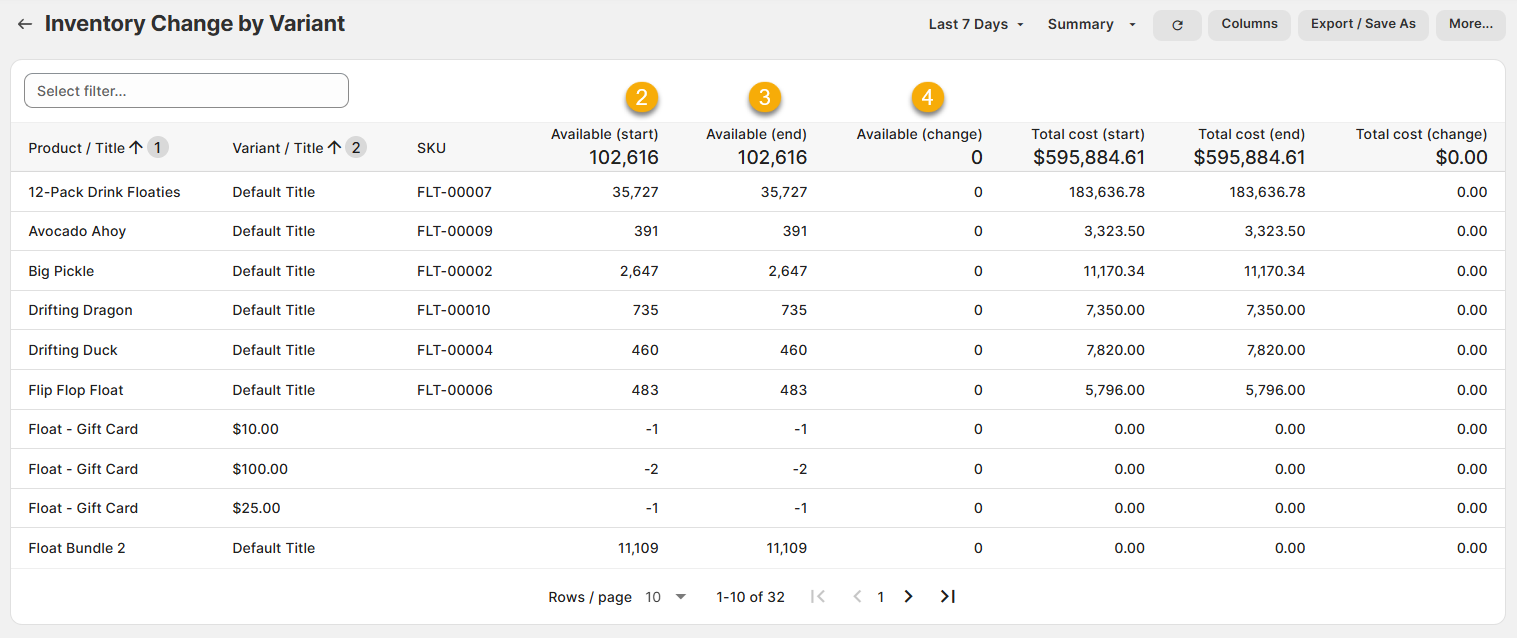
Inventory Change by Variant
This report is designed to make it easy to track the values for each variant at the start of the period, the end of period, and even any changes between the two.
(click image to enlarge)
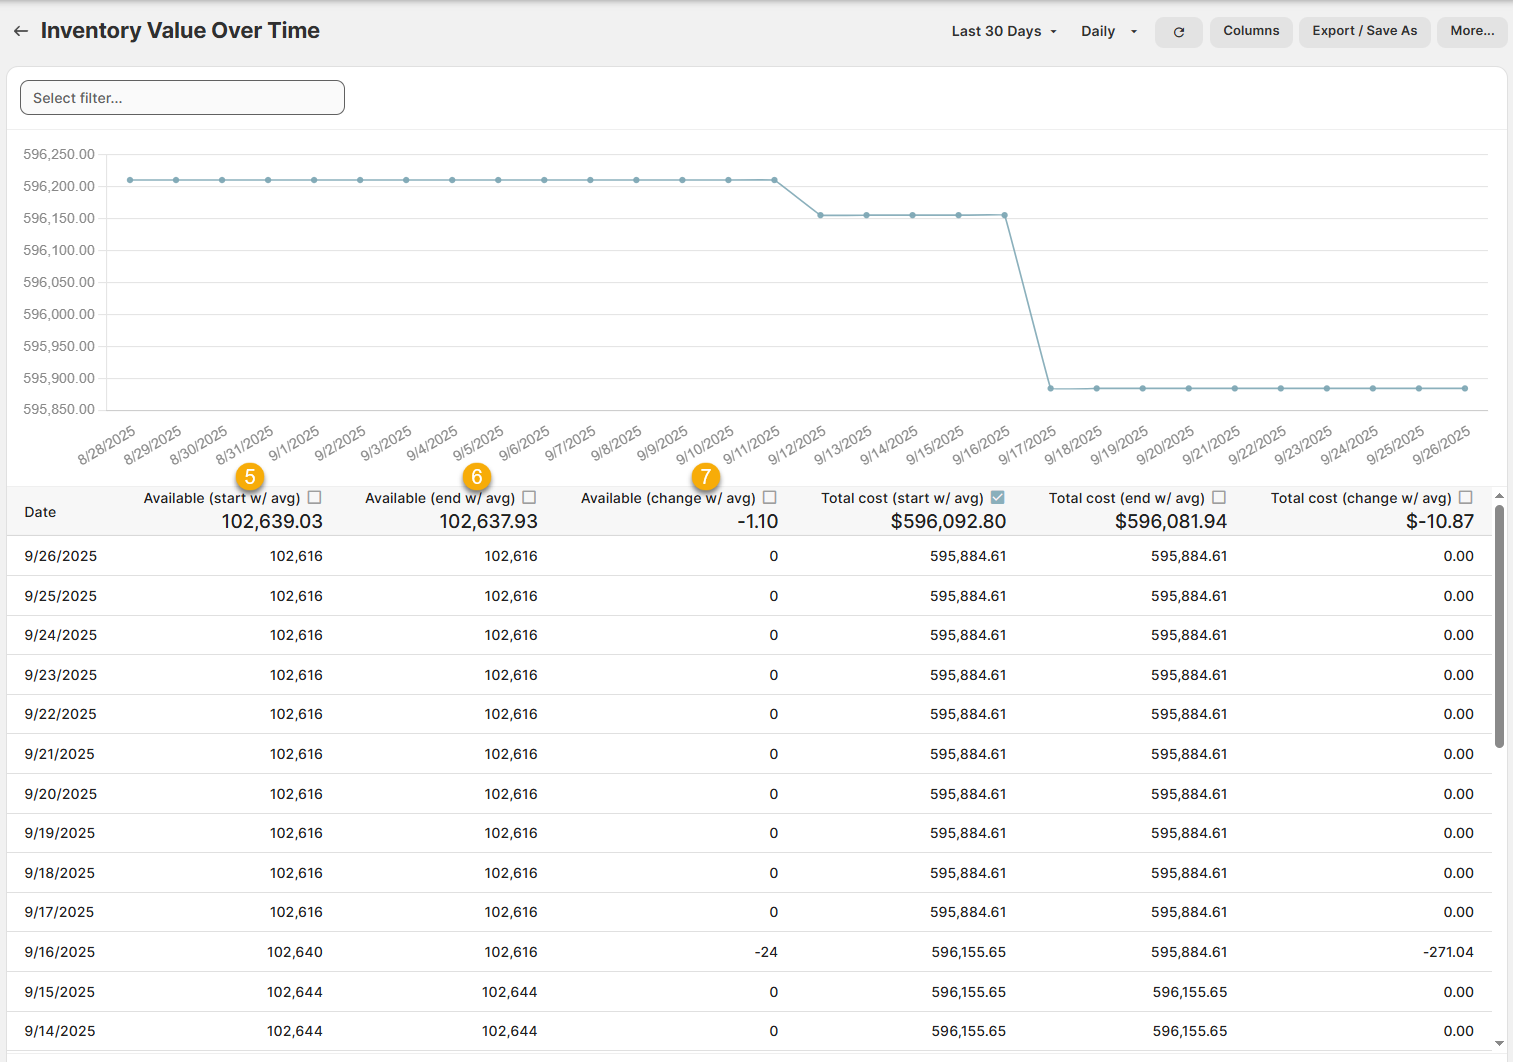
Inventory Value Over Time
This report is designed to let you see the cost-based value for your entire inventory on a daily or weekly basis.
Each row shows the total values at the start/end of period (Daily, so this is start/end of each day by default), any changes between the two, and averages in the header.
(click image to enlarge)
Please note - Inventory History is only tracked from the time this feature is enabled for your account.
For example, if we enabled the feature for you on 6/20/23, you would have Inventory history from this date onwards.
Here are a few terms to be familiar with in order to understand Inventory History, numbered in the screenshots (above):
1.) Inventory States: These are common across most of our inventory history reports, and use the same definitions as Shopify's.
Available. The number of units you have available to sell
Committed. The number of units you have already sold of an item but have yet to fulfill
Reserved. The number of units you have listed as unavailable to sell. Usually these are units that have been reserved by draft orders or another app.
On Hand. The total of Available + Committed + Unavailable
Incoming. The number of units you have listed as on their way to your inventory location.
2.) ____ (Start): The number of units at the start of the time period. This is determined by the first date in the selected range.
For Total cost (Start), this is instead the cost-based inventory value at the start of the time period.
For example, if the report was set to Last 7 Days and today is 6/20/23, then Available (Start) would be the # of units available on 6/14/23.
If I looked at the same report tomorrow, it would be the amount available on 6/15/23.
3.) ____ (End): The number of units at the end of the time period. This is determined by the last date in the selected range.
For Total cost (End), this is instead the cost-based inventory value at the end of the time period.
For example, if the report was set to Last 7 Days and today is 6/20/23, then Available (End) would be the # of units available on 6/20/23.
If I looked at the same report tomorrow, it would be the amount available on 6/21/23.
If the date range on the report itself covers a complete time period (e.g. today is Monday and the report was set to Last Week), then ____ (End) will represent the value as of the last snapshot
If the date range on the report itself covers an incomplete time period (e.g. Today), then ____ End will represent the value as of right now (the end snapshot of course won't have run for today yet!)
4.) ____ (Change). The difference between ____ (Start) minus ____ (End).
For example, if the Available (Start) was 20 and the Available (End) was 5, then the Available (Change) would be 20 - 5 = 15.
5.) ____ (Start w/ avg). The same as ____ (Start), above, but with an average in the header.
For example, if the report was set to Last 7 Days, Daily, and the Available (Start) at the beginning of each day was 2, 2, 4, 4, 6, 8, 9, then Available (Start w/ Avg) would be 2+2+4+4+6+8+9 = 35, which divided by 7 = 5.
6.) ____ (End w/ avg). The same as ____ (End), above, but with an average in the header.
For example, if the report was set to Last 4 Weeks, Weekly, and the Available (End) at the end of each week was 6, 12, 8, 14, then Available (End w/ Avg) would be 6+12+8+14 = 40, which divided by 4 = 10.
7.) ____ (Change w/ avg). The same as ____ (Change), above, but with an average in the header.
For example, if the report was set to Last 3 Days, Daily, and the Available (Change) each day was -5, +17, -3, then Available (Change w/ Avg) would be -5 + 17 - 3 = 9, which divided by 3 = 3.
Like all Report Toaster reports, these reports are fully customizable - so you can adjust the date range, add/remove columns, introduce a filter or change the sort to suit your individual needs. See our basic guides here for more info.
If you want to see your Inventory Turnover, check out our other similar reports here.