
Whats New? - January 2023
It's the start of a new year, and we wanted to kick things off with something exciting — comparison ranges in Report Toaster!
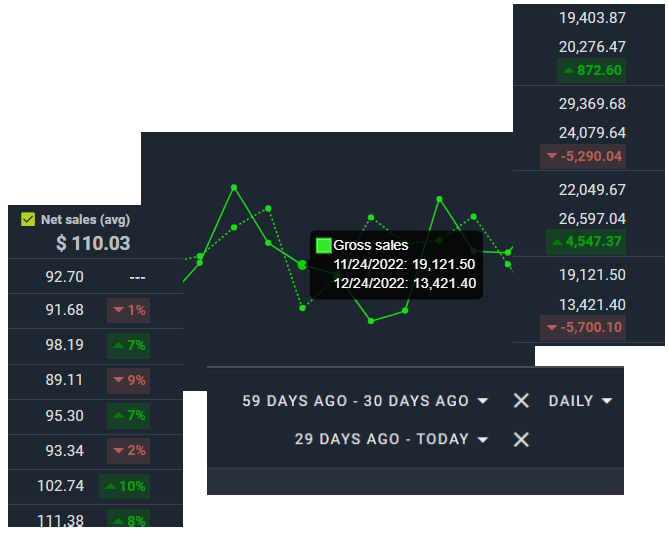
(click image to enlarge)
Some of you might be familiar with the feature in Shopify that lets you compare reports with a prior period. Well, now we have this capability in Report Toaster — and we made some improvements too!
These comparison ranges in the chart work on any of our chart reports, so as you can imagine the possibilities are virtually limitless.
With this feature you can:
Add one or more date ranges for comparison of almost any metric
Compare your performance week-over-week, month-over-month or even year-over-year
See how numbers change over a time series like daily, weekly or monthly
Highlight key percentage spikes and dips so you can analyze the root causes in further depth
And so much more!
Note: For more information on Comparison Ranges and how to set these up, check out our main guide here.
At the moment the comparison ranges feature is in beta, so we're making it freely available to all our merchants for a limited time.
Most of our competitors don't have anything like it, so please check it out, give us your feedback, and let us know if you need help setting up a particular report.
Until next time!