Whats New? - September 2023
This September, we thought it was time to do a year in retrospect - covering all the great new features we've added to Report Toaster!
Every month we've aimed to introduce something interesting, whether it's new reports, enhanced options, or even brand new capabilities that make the app that much better than it was before.
But with the sheer pace of recent updates, we're sure that many of you might have already missed some things we've added in the last year.
So whether you haven't looked around much lately (or are simply looking for an overview) well... look no further!
Let's dive in :)
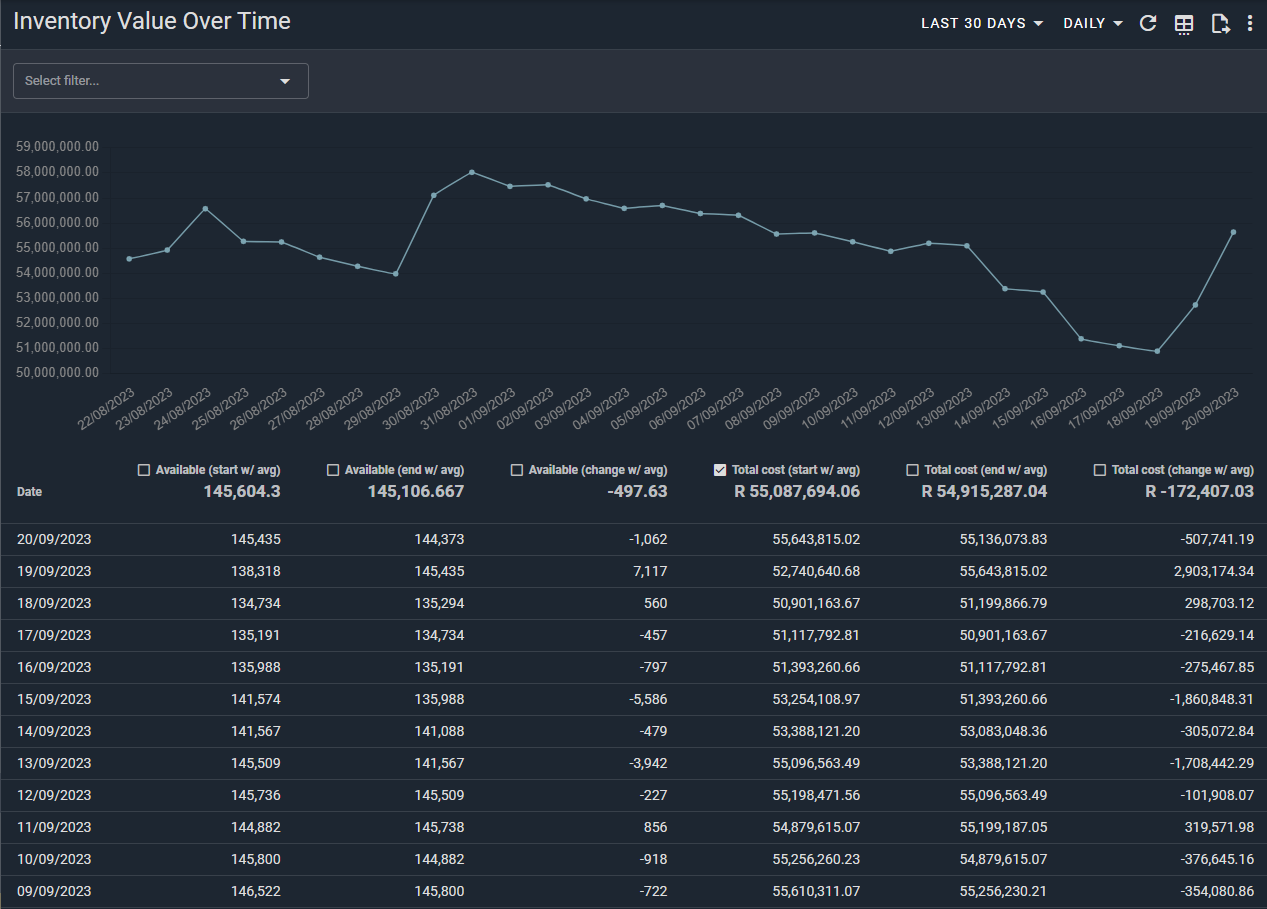
Inventory History
Once enabled, Inventory History lets you track changes to your historical inventory levels on an ongoing basis, including Cost and Price changes over time.
These reports also include Inventory States (Available, On Hand, Incoming, Committed, Reserved), the values at the start and end of each time period (determined by the date), and any changes to the values within that time.
(click image to enlarge)
You can also utilize our Inventory Turnover reports to measure how much inventory has been sold and replaced over a period of time.
Premium Reports
Over 20+ Premium Reports have been added to Report Toaster, covering everything from Revenue Recognition and Tax Reports to Repeat Purchase Rates and First Time vs Returning Sales.
There are too many reports to list them all, so check out our main section here to see a complete list (don't forget page 2!).
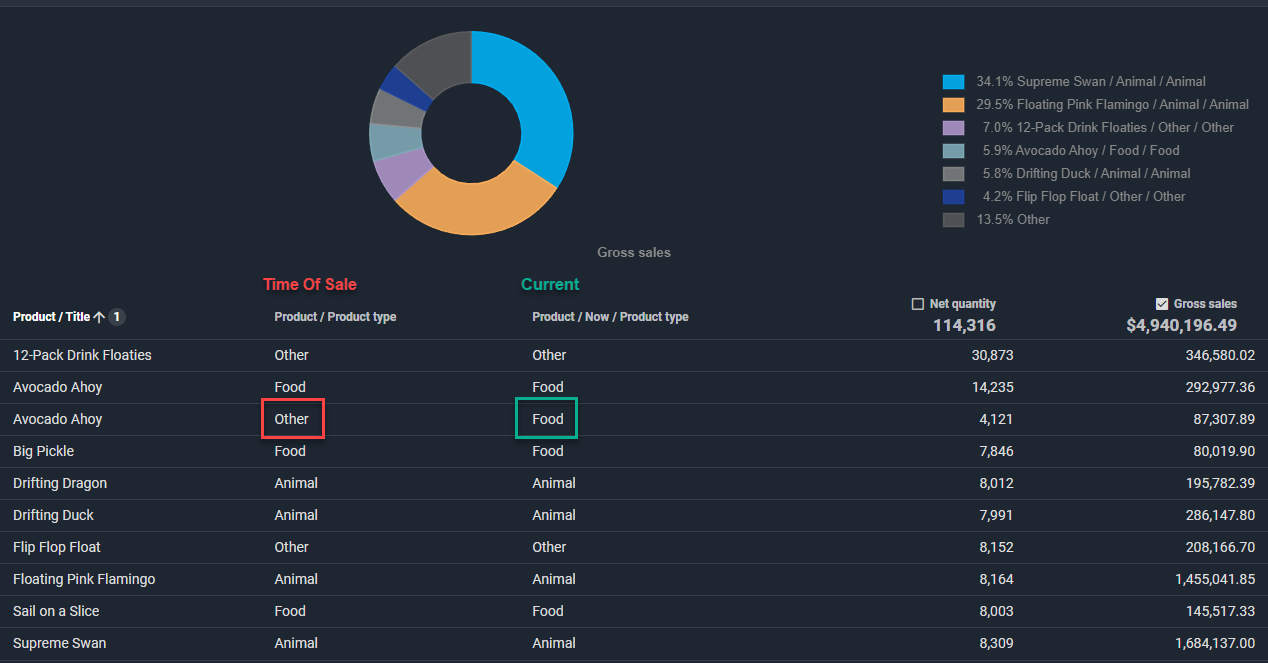
'Now' Fields
A much-needed addition to Sales Reports, 'Now' Fields let you track certain attributes as they are now in your Shopify store, as opposed to what was true at the time of Sale.
(click image to enlarge)
This is crucial for things like Tags, Product Types, Product/Variant Titles, and of course, anything else you plan on updating on a regular basis.
You can choose between which field you want to use in any of our columns or filters on Sales reports.
See our main guide here for more info.
Simple Bundles
Ideal for Simple Bundles customers, these reports let you track bundle sales separately from other sales.
This is crucial for cases where you need to track sales of any bundle items (e.g. buy 4 food items, get a 5th for free) separately from items being bought separately.
You can use these reports both to get more accurate sales numbers and track certain trends over time.
See more information about this partnership here.
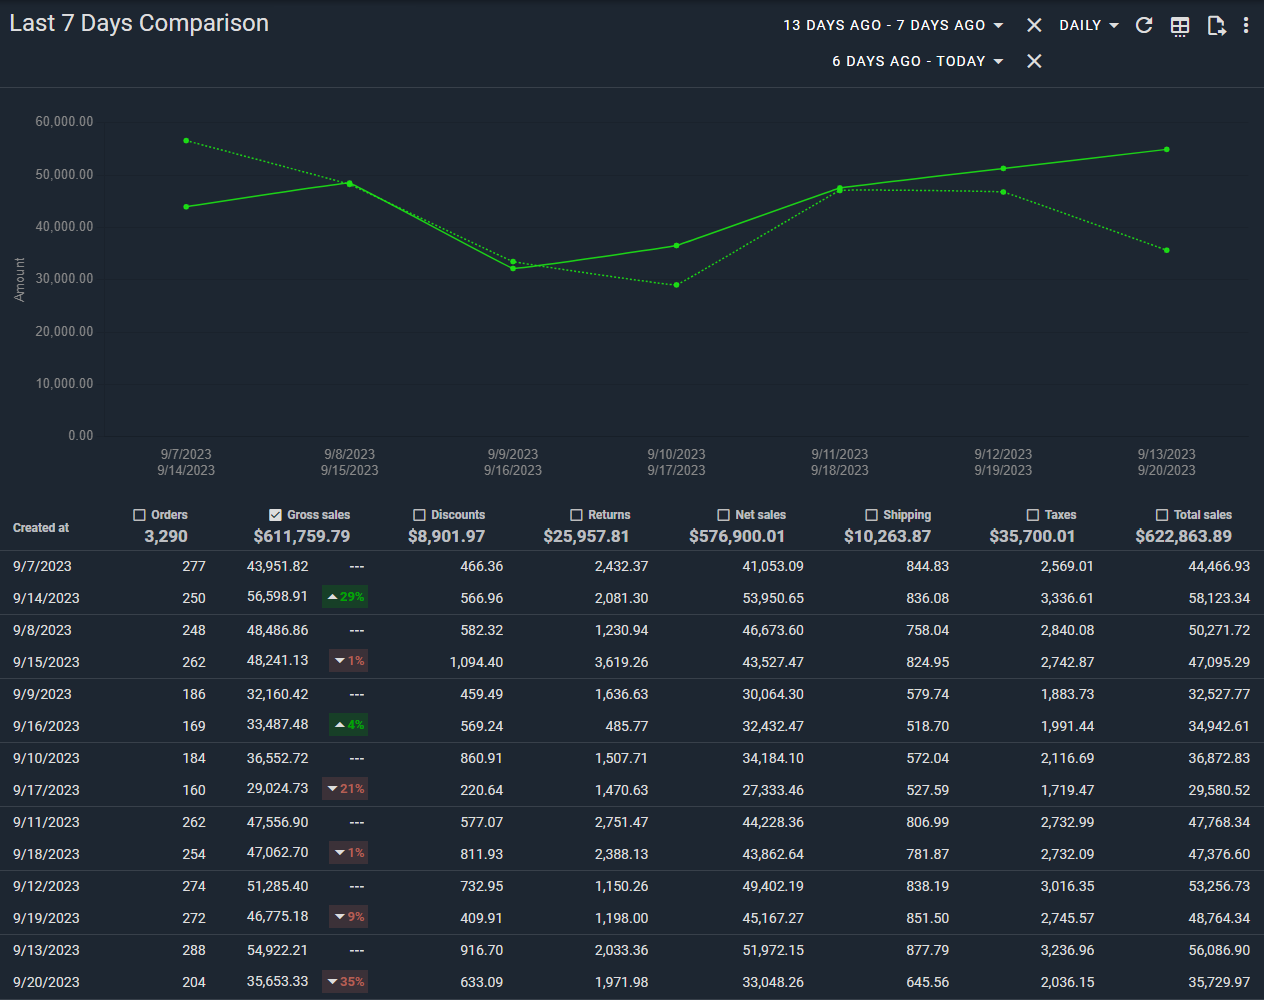
Comparison Ranges
This feature lets you add multiple time ranges and compare the differences between them (both in absolute numerical terms and a % change).
(click image to enlarge)
This is useful for analyzing changes over a specific range.
You can use our default reports like Last 7 Days/Last 30 Days Comparisons to automatically compare to the prior period and measure performance over time.
See our main guide here for more information.
Tax Reports
We've made a number of improvements to our Tax reports, including adding Taxes by County and making improvements to include Shipping, adjustments, and individual Sales lines.
See our main guide here for further info.
Sell-Through Reports and Sales Velocity
These reports let you compare how well something is selling compared to how much you have in stock.
With these reports, you can not only see the Sell Through Rate (STR), but you can also see your Average Daily Sold and things like Days Remaining to see how long your inventory will last at current levels.
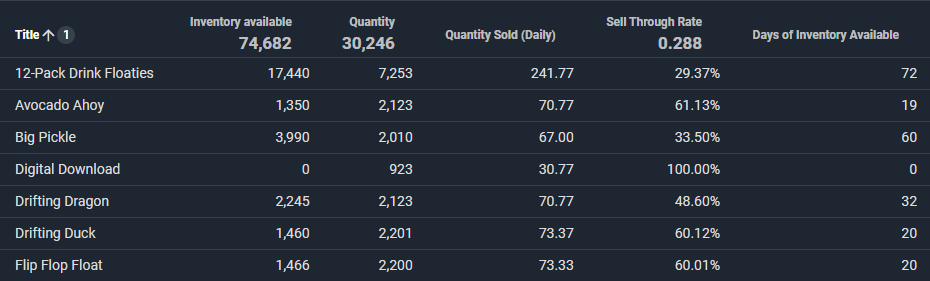
(click image to enlarge)
Click here to learn more about Sell Through, and here to see our Sales Velocity report.
If you'd like to see an overview of any of these features or are looking for more great reasons to signup, check out our main guide here.
Otherwise, if you have any further questions,